Google Analytics is an awesome reporting tool to track website traffic performance and it offers a lot of data one needs to analyze almost every aspect of one’s traffic and website visitor information. The only cost of entry is setting up a free Analytics account and adding the JavaScript tracking code to your website. But unless you’ve spent a lot of time and effort getting used to the enormous wealth of data available from the Analytics dashboard, all that information can be daunting.
While the report that shows up on the default analytics dashboard is useful, I find it paints an incomplete picture of what type of traffic a website has – you can’t see what type of traffic is influencing your data trends. Thankfully, a better report is only a few clicks away and you don’t need to be an analytics whiz to make sense of it. Peep the video below and/or read the quick steps to get a good overview of your website traffic so you can make informed decisions about what to change or keep doing in your traffic generation strategies.
The steps to the website traffic channels report
- Log in to your Analytics dashboard
- From the left column, expand the “Acquisition” section, then “All Traffic”, then click “Channels”.
- In the “Default Channel Grouping” column, check the box next to the channels you want to plot.
- Then click the “Plot Rows” button above that “Default Channel Grouping” column. Boom! Done.
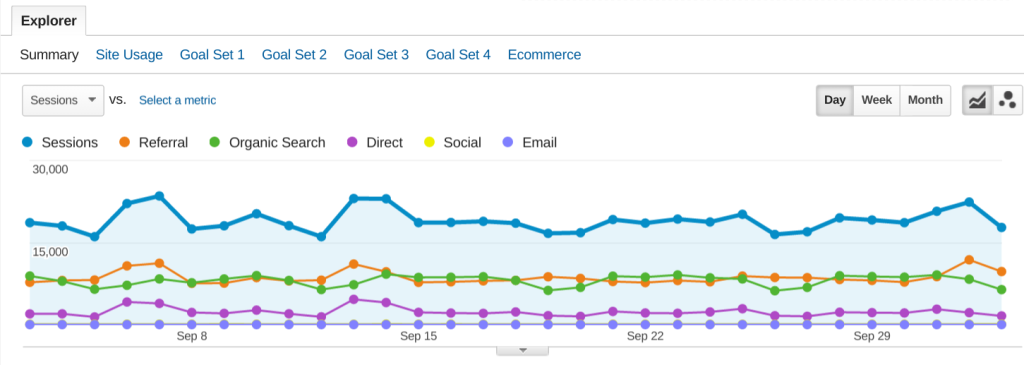
The report explained
Your website gets traffic from various places (channels), and the default Analytics graph lumps all your website traffic together. There’s “direct” traffic, which is generated by people manually typing in your website URL into the browser, bookmarks, and those bit.ly/asd90 type links in tweets. “Referral” traffic are visitors that have come to your website by clicking a link from another website. “Organic Search” are visitors getting to your site from search engine results, “Social” from social platforms like Facebook or Twitter, and “Email” are clicks from email clients.
When you plot our those channels separately, you can see how each of your traffic sources is performing and then make solid decisions on where to focus business efforts. For instance, if you see referral traffic dragging your overall traffic numbers down, but your organic search is trending up, then you know you should keep doing what you’re doing regarding content and meta tags and focus on getting 3rd-party websites to link to you.
